Profiling
In this lesson, we are going to take a look at debugging and profiling. Since type inference is central to writing performant Julia code, we will also take a look at how to fix inference problems.
We will demonstrate both the Julia VSCode extension and editor-agnostic packages.
Table of Contents
To demonstrate profiling, we are going to use an example from the ProfileView.jl documentation:
function profile_test(n)
    for i = 1:n
        A = randn(100,100,20)
        m = maximum(A)
        Am = mapslices(sum, A; dims=2)
        B = A[:,:,5]
        Bsort = mapslices(sort, B; dims=1)
        b = rand(100)
        C = B.*b
    end
end
Note that this function runs the inner computation n-times to obtain a more accurate profile.
VSCode extension
To run the profiler from the Julia VSCode extension, simply call your code using the @profview macro. It is recommended to call this twice: once to trigger compilation and once to obtain the actual profile:
@profview profile_test(1)  # run once to trigger compilation (ignore this one)
@profview profile_test(10) # measure runtime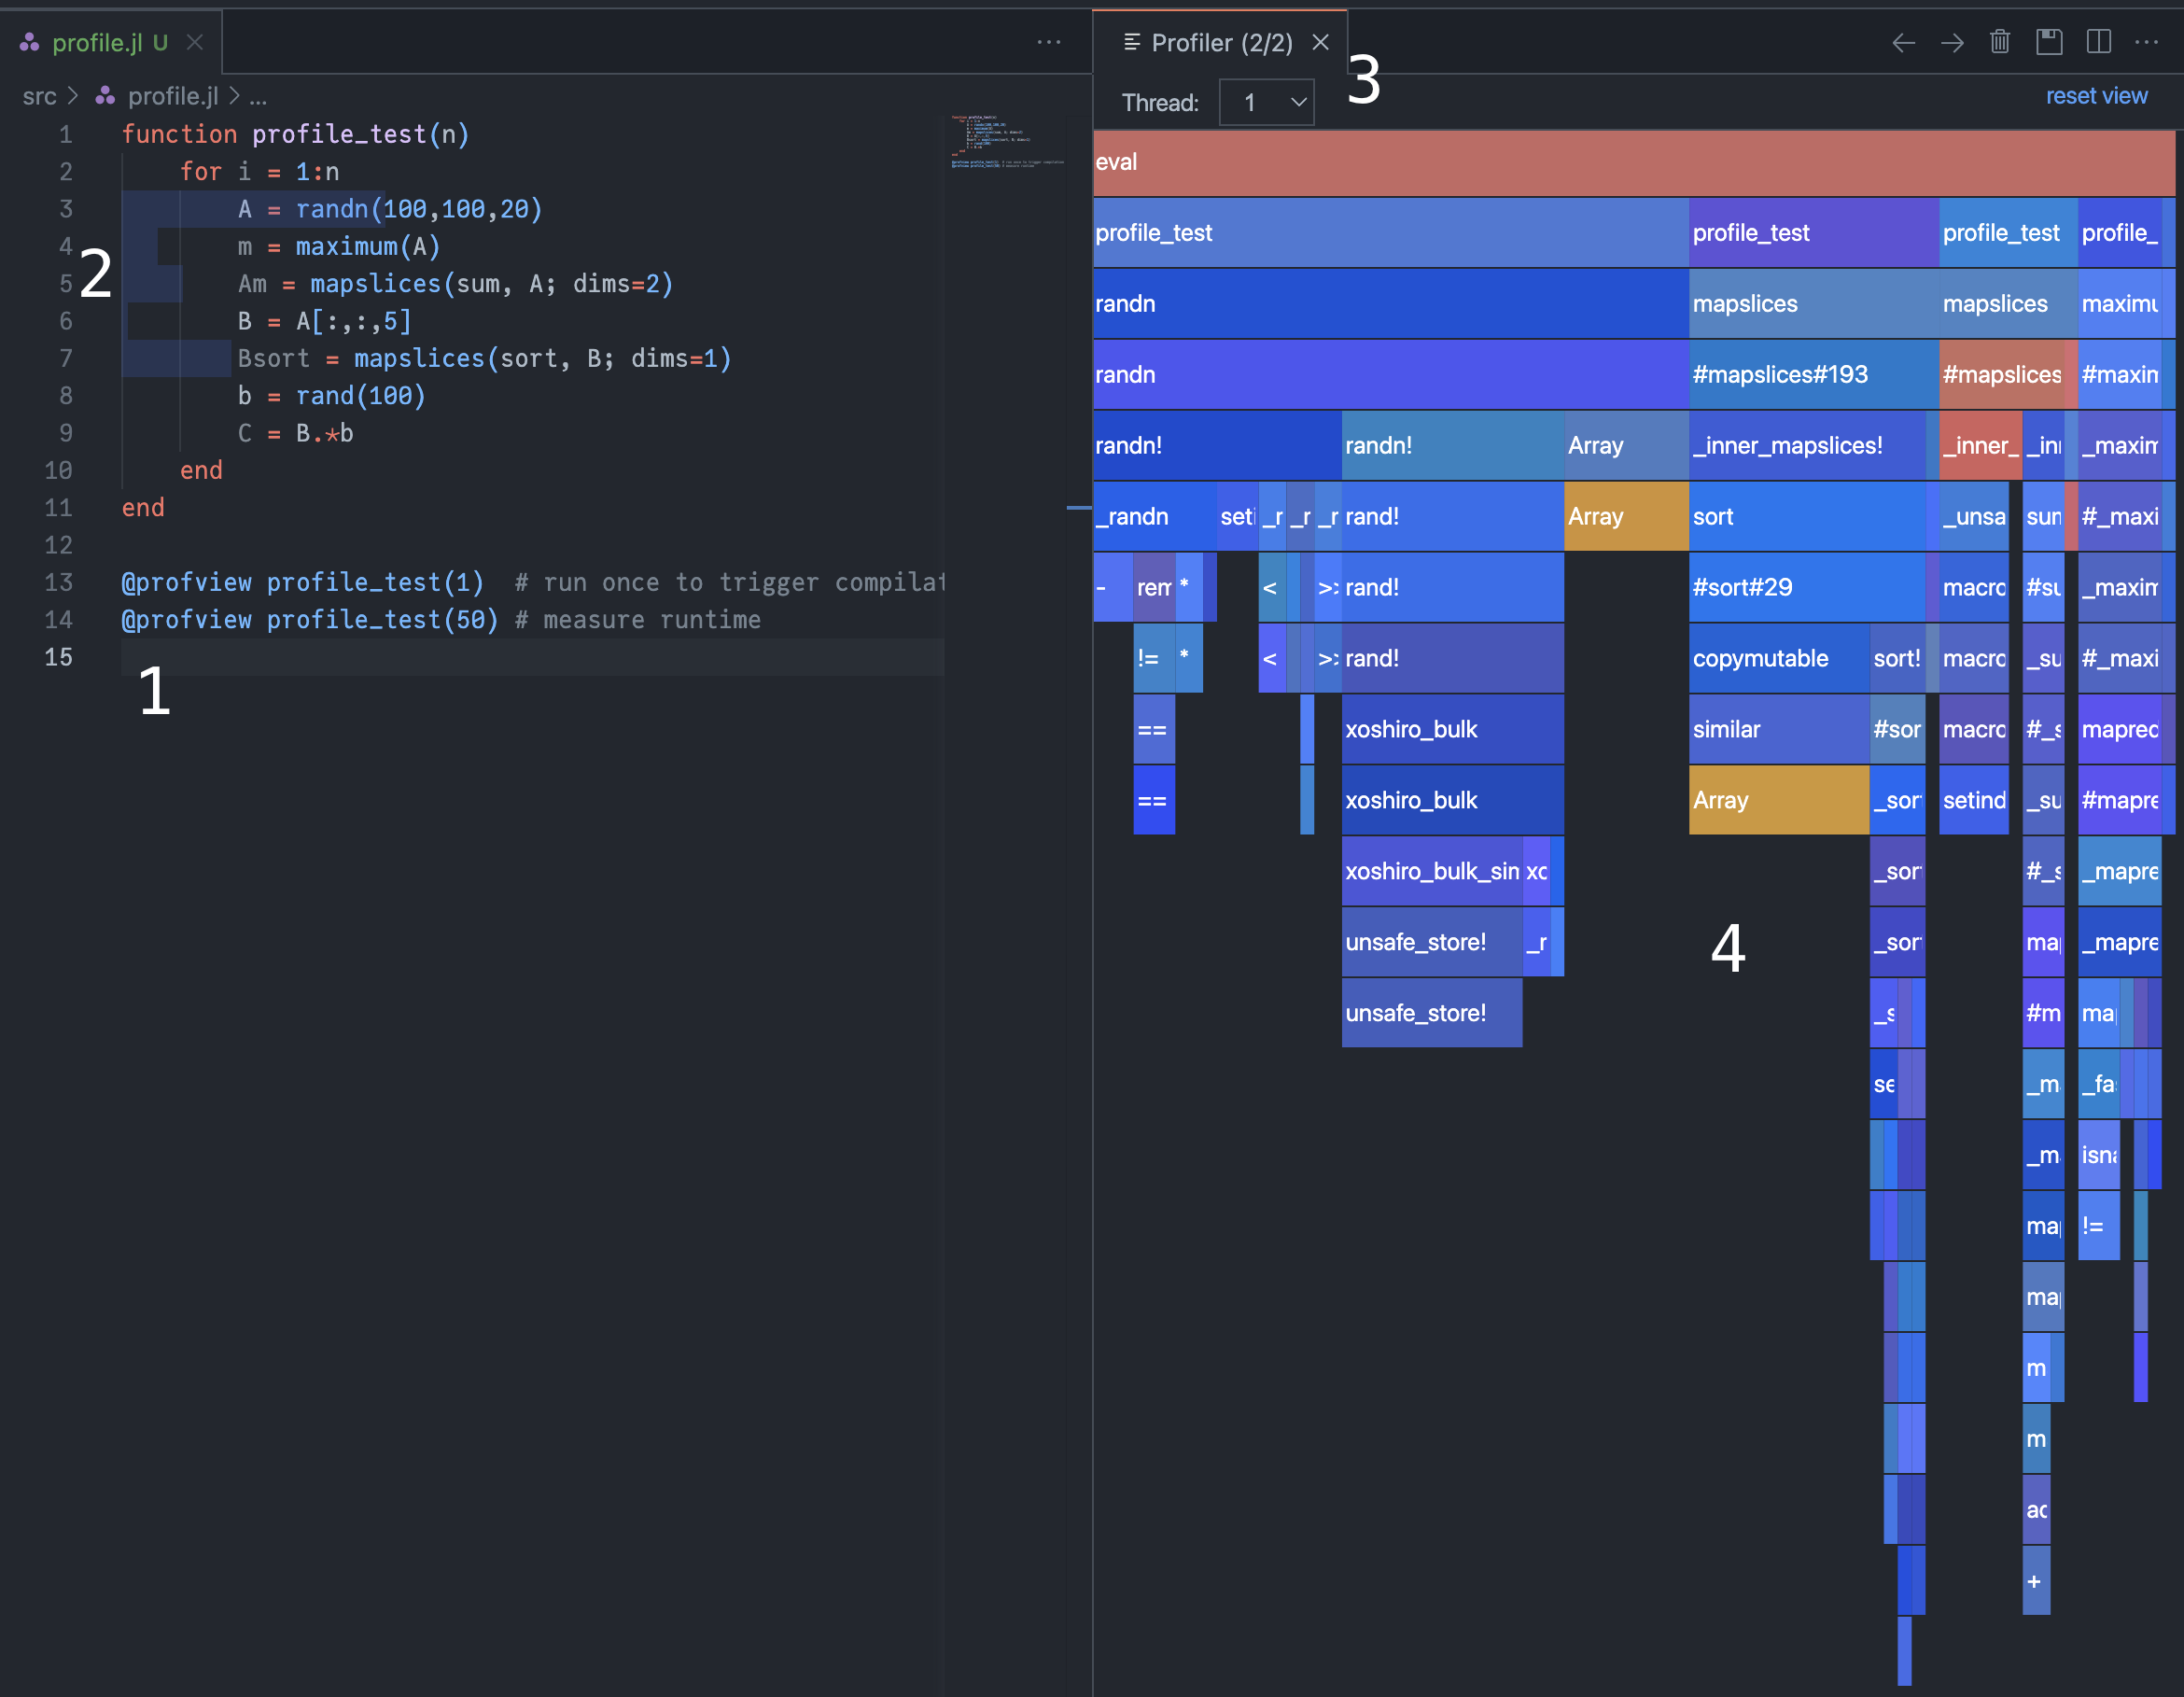
After calling the macro (point 1), our code is highlighted by a bar plot, indicating how much time is spent in each line of code (point 2).
A more detailed view on this can be found in the profiler window. After selecting the relevant thread (point 3), we can inspect the flame graph of our function call (point 4).
Vertically, this graph visualizes the call stack of our function, with the "root" function call at the top and "leaves" at the bottom. Hovering your mouse over a block will indicate the function name, as well as its source file and corresponding line number.
The duration of each function call is visualized by the horizontal space each block takes up in the graph. On this machine, most time was spent allocating the large random matrix A.
The color of the blocks also contains information:
Yellow indicates calls to the garbage collector. If you see many of these, you might want to use
@viewsinstead of allocating memory.Red indicates run-time dispatch: the Julia compiler can't infer which types a function is going to encounter before actually running the code. We will see how to fix these using Cthulhu.jl at the end of this lecture.
Importance of type inference
Let's take a look at a second example (taken from ProfileView.jl) to highlight the importance of type inference:
function profile_test_sort(n, len=100000)
for i = 1:n
list = []
for _ in 1:len
push!(list, rand())
end
sort!(list)
end
end
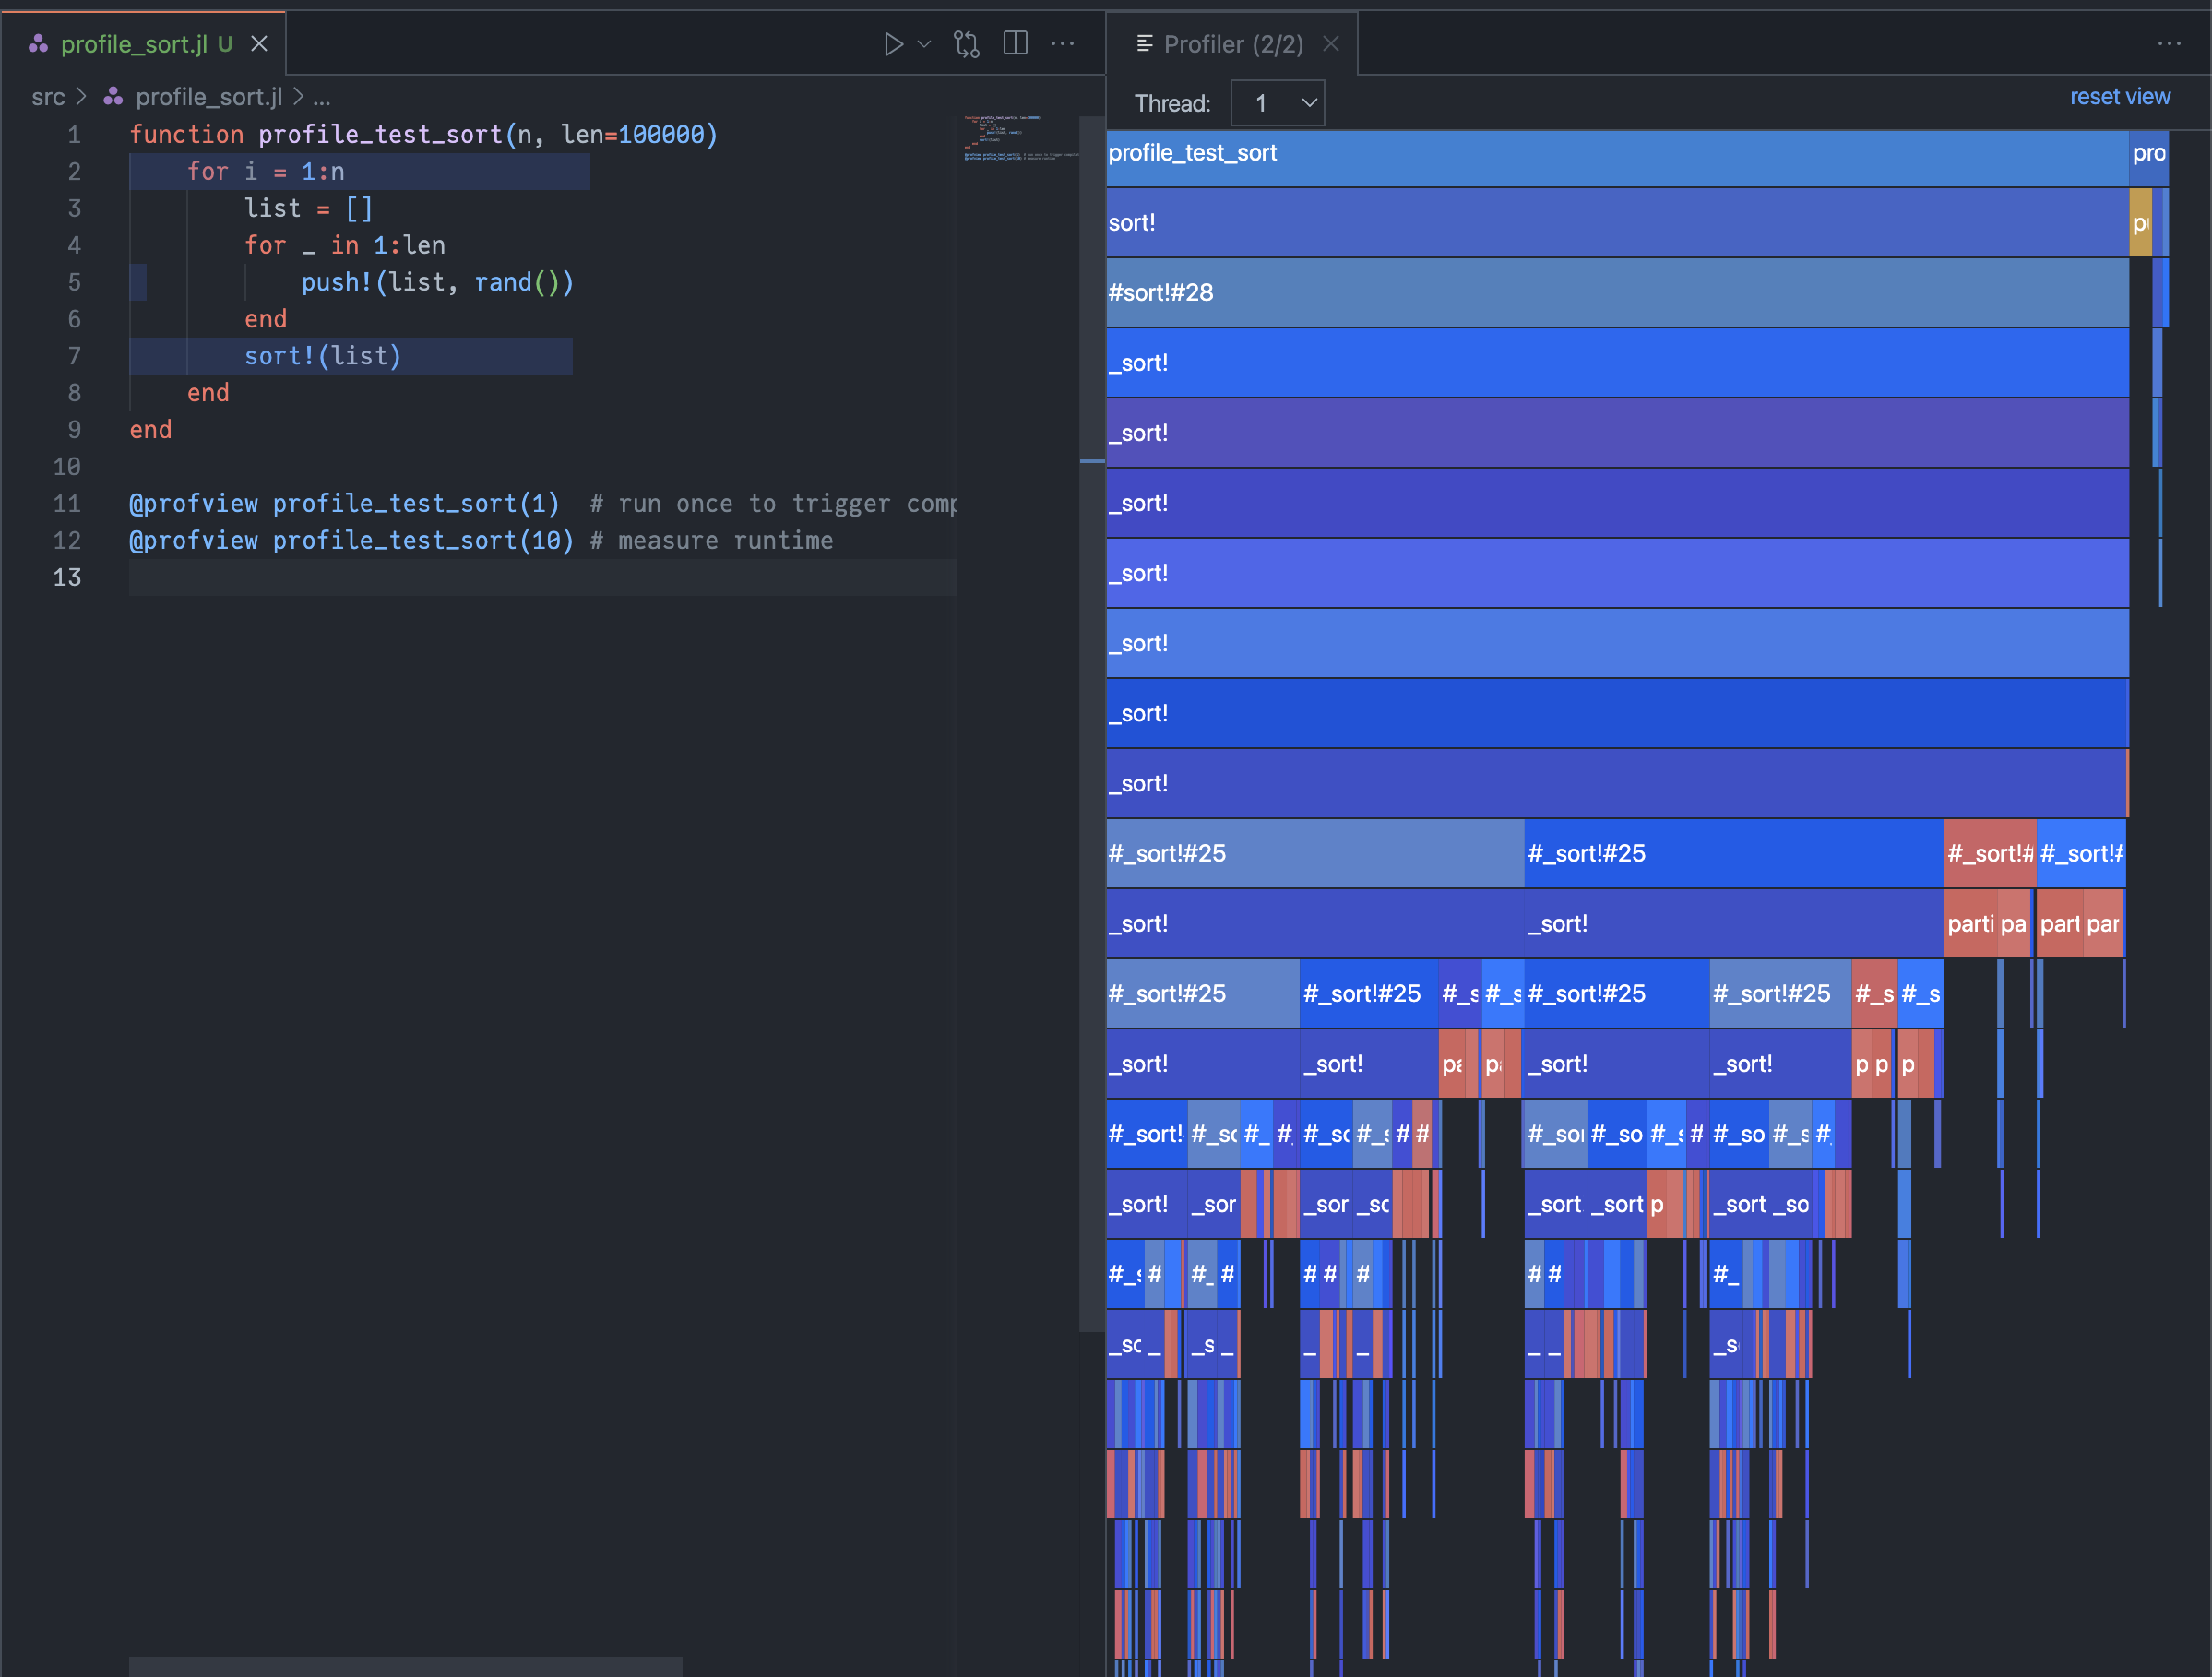
@profview profile_test_sort(1) # run once to trigger compilation (ignore this one)
@profview profile_test_sort(10) # measure runtimeSince list = [] is of type Vector{Any}, Julia can't infer its type. This is also visible in the profile, which looks fragmented and contains many red blocks:
As expected, the function is quite slow:
julia> @time profile_test_sort(10)
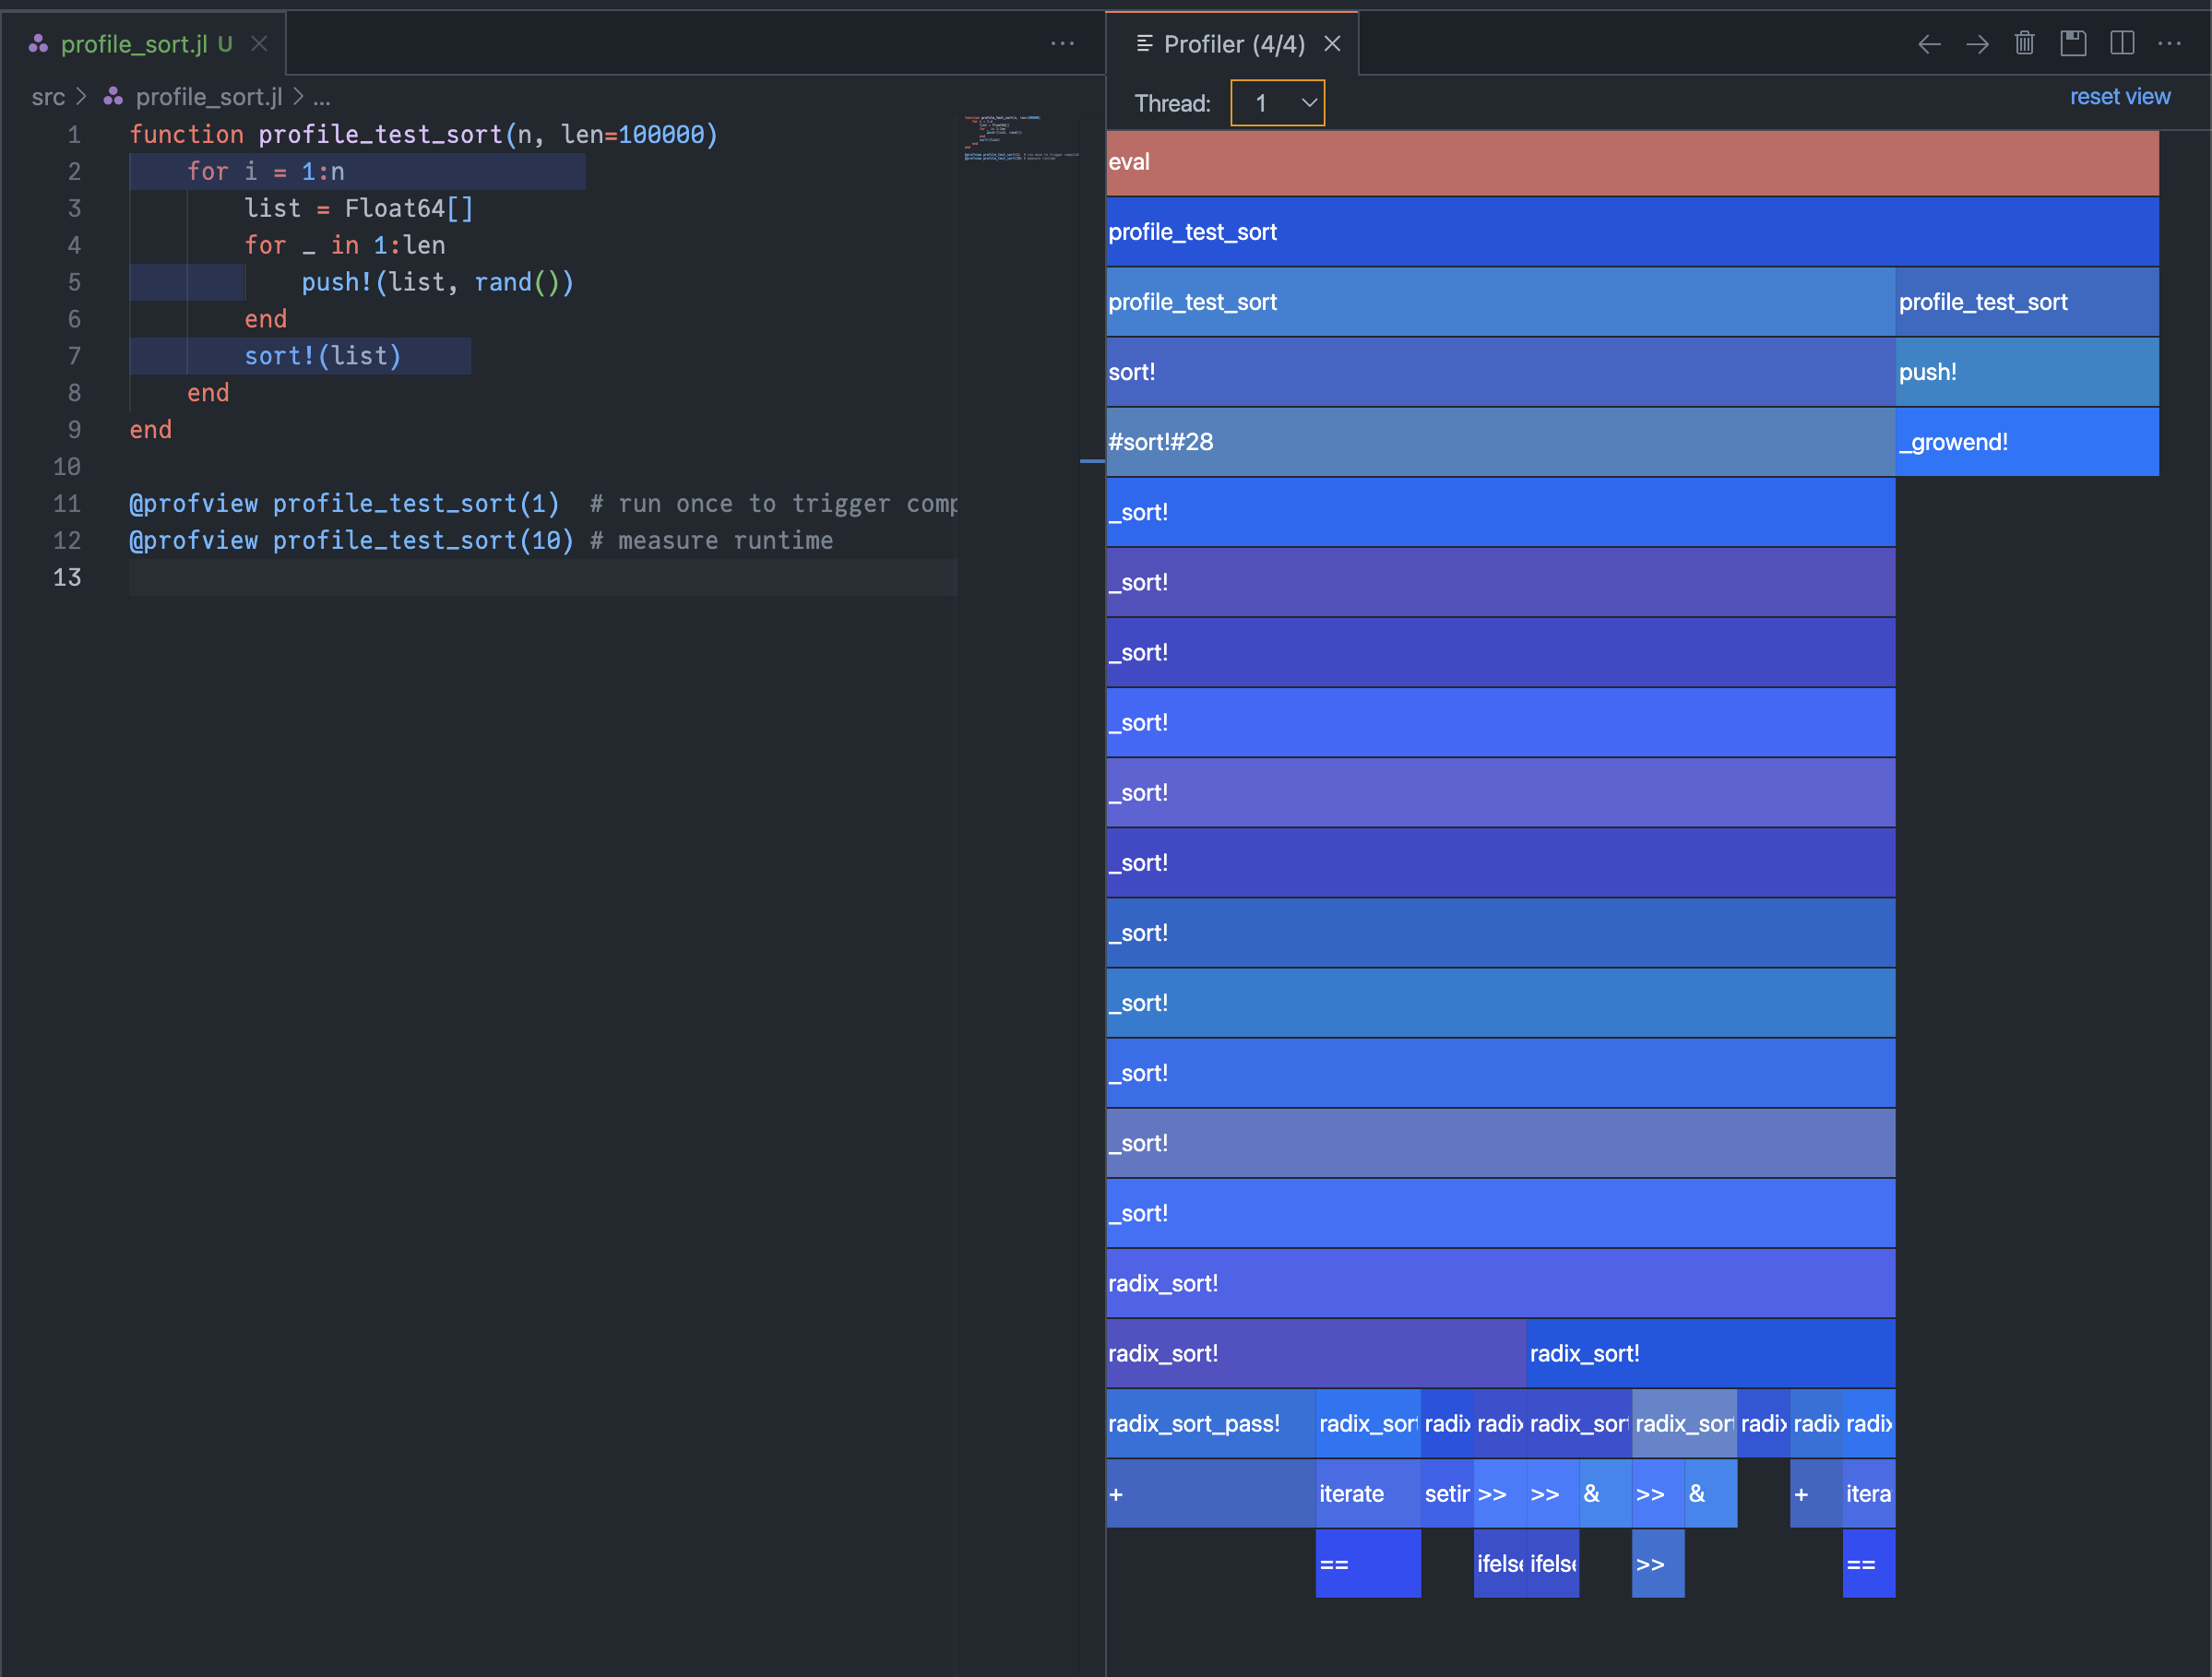
0.442308 seconds (1.00 M allocations: 41.165 MiB, 1.31% gc time)By changing the third line to list = Float64[], the Julia compiler can infer that it is working with a Vector{Float64} and generate more performant code. We can see in the profiler that the generated code is much simpler and type stable:
julia> @time profile_test_sort(10)
  0.034384 seconds (140 allocations: 25.986 MiB, 14.58% gc time)
This corresponds to a 10x increase in performance!
ProfileView.jl
Instead of using VSCode, we can make use of ProfileView.jl to profile our code, which uses the same @profview macro:
julia> using ProfileView
julia> function profile_test_sort(n, len=100000)
for i = 1:n
list = []
for _ in 1:len
push!(list, rand())
end
sort!(list)
end
end
profile_test_sort (generic function with 1 method)
julia> @profview profile_test_sort(1)
Gtk.GtkWindowLeaf(...)
julia> @profview profile_test_sort(10)
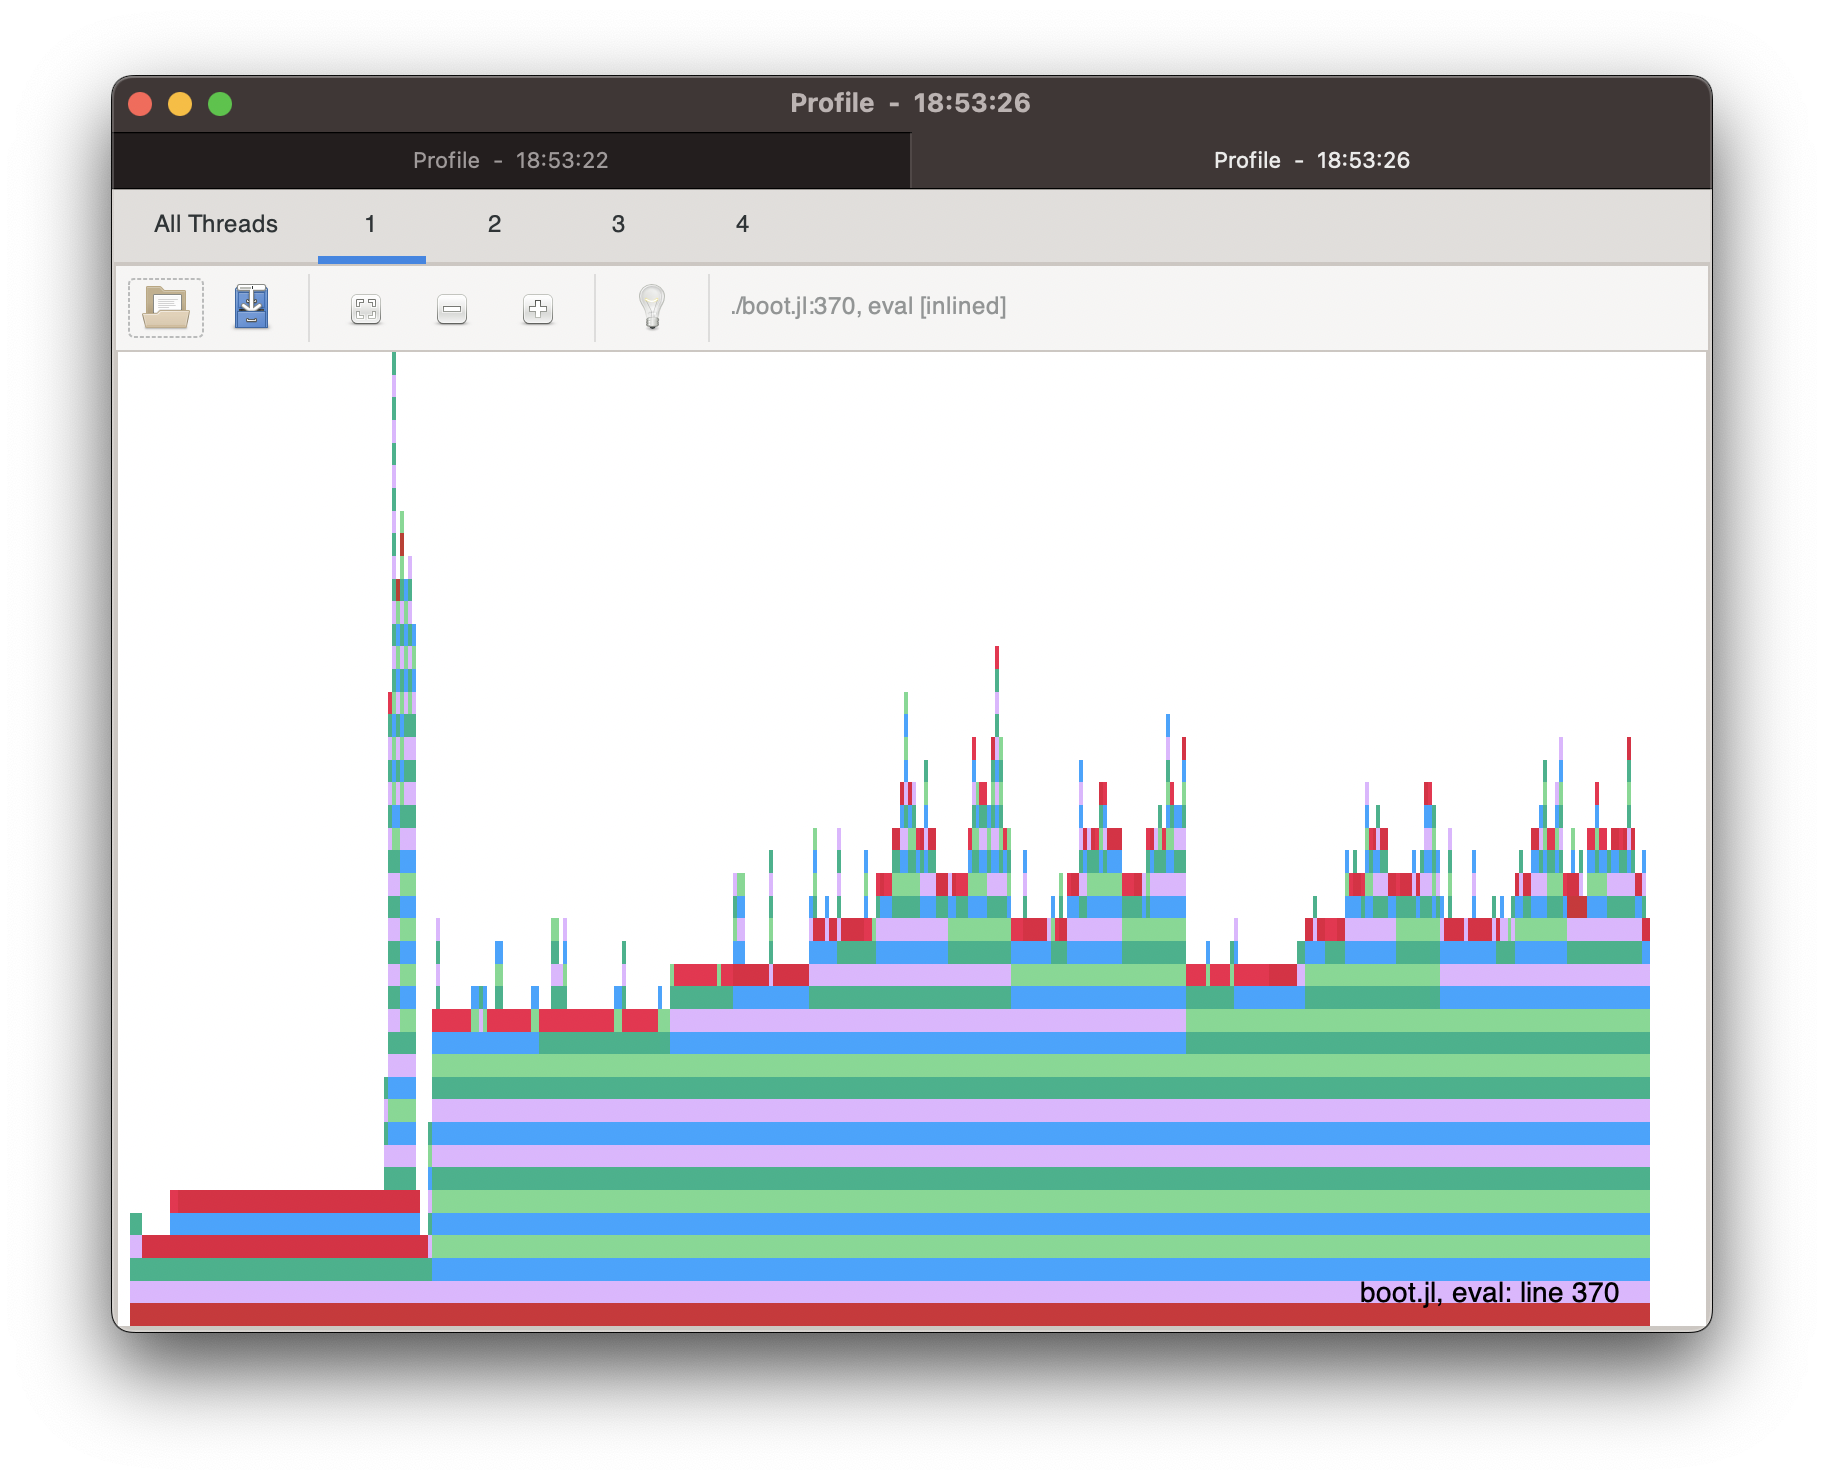
Gtk.GtkWindowLeaf(...)This will open a new GTK window with the profile. The only difference to VSCode is that the flame graph is flipped vertically:
Type stability
Since we've seen how important type inference is for performance, we are going to demonstrate two tools that help us find inference problems.
For this purpose, we are going to use an example from the Cthulhu.jl documentation:
function foo()
    T = rand() > 0.5 ? Int64 : Float64
    sum(rand(T, 100))
end
This function "flips a coin" to determine whether T is the type Int64 or Float64. It then samples 100 numbers of type T and sums them up. This is obviously type unstable, since Julia can't infer types before running the function.
@code_warntype
The output of @code_warntype is similar to to that of @code_lowered, which printed the intermediate representation (IR) of our Julia code. However, @code_warntype additionally shows type information:
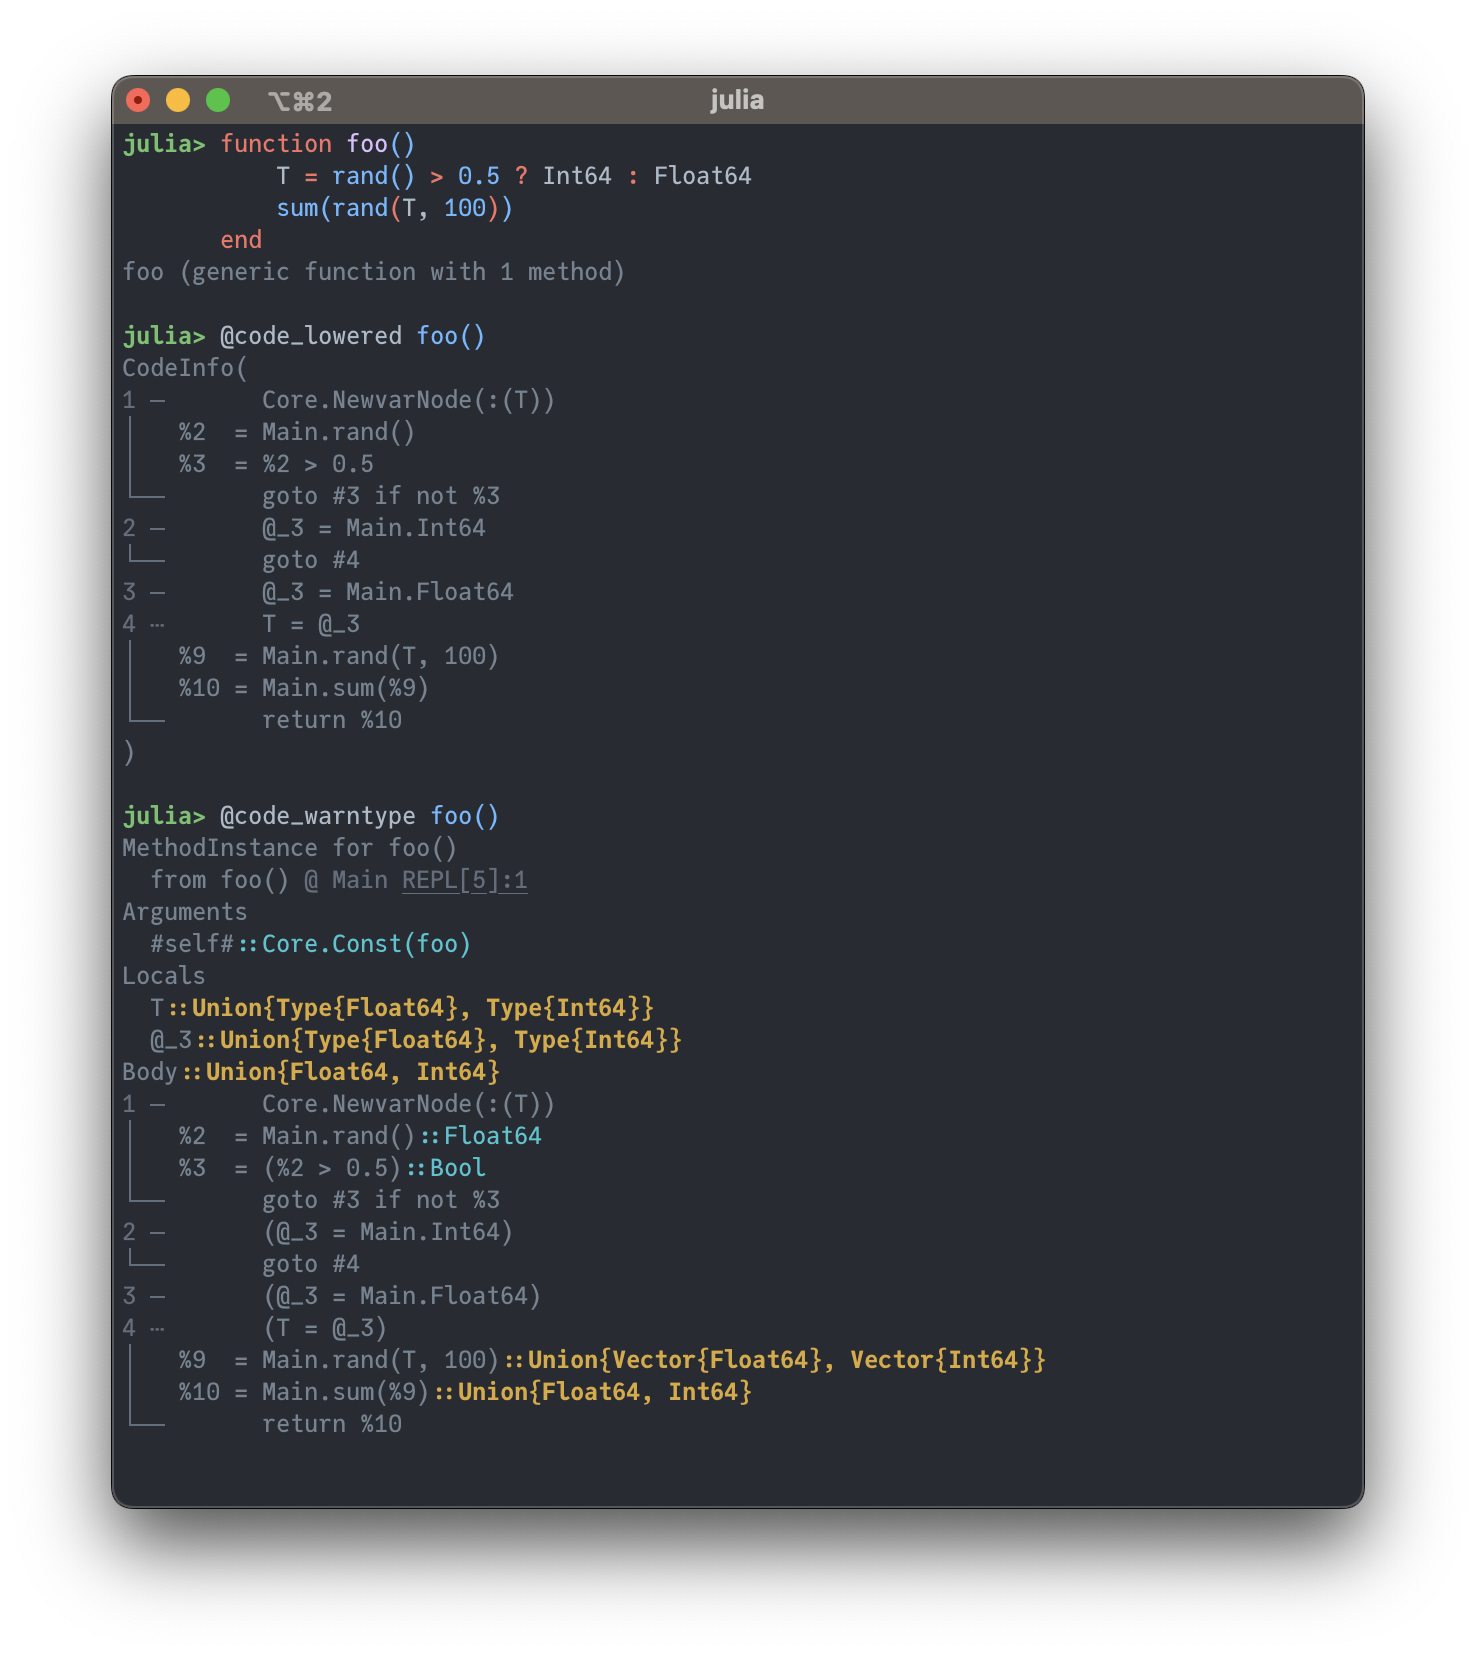
We can see type-stable statements in blue/cyan:
rand()returns aFloat64rand() > 0.5returns aBool
Highlighted in yellow are "small concrete unions", for example:
T, which is a union type of two types:Union{Type{Float64}, Type{Int64}}our random array of size 100, which is a
Union{Vector{Float64}, Vector{Int64}}the return value of
sum, which is aUnion{Float64, Int64}
These union types are not always a problem, as long as they don't result in a combinatorial explosion of possible types.
A big disadvantage of @code_warntype is that it only shows us inferred types for the exact function call we applied the macro to. Type instabilities in inner functions calls are not always visible.
Cthulhu.jl
Warning
This is a tool for advanced users and might be confusing to beginners.
Cthulhu.jl is the advanced user's version of @code_warntype. It allows us to recursively "descend deeper" into our code until we find a point at which type inference failed.
Calling @descend on a function will start a command-line interface to interactively explore our code with type-annotations. Since this interface is pretty dense in information, it can look intimidating:
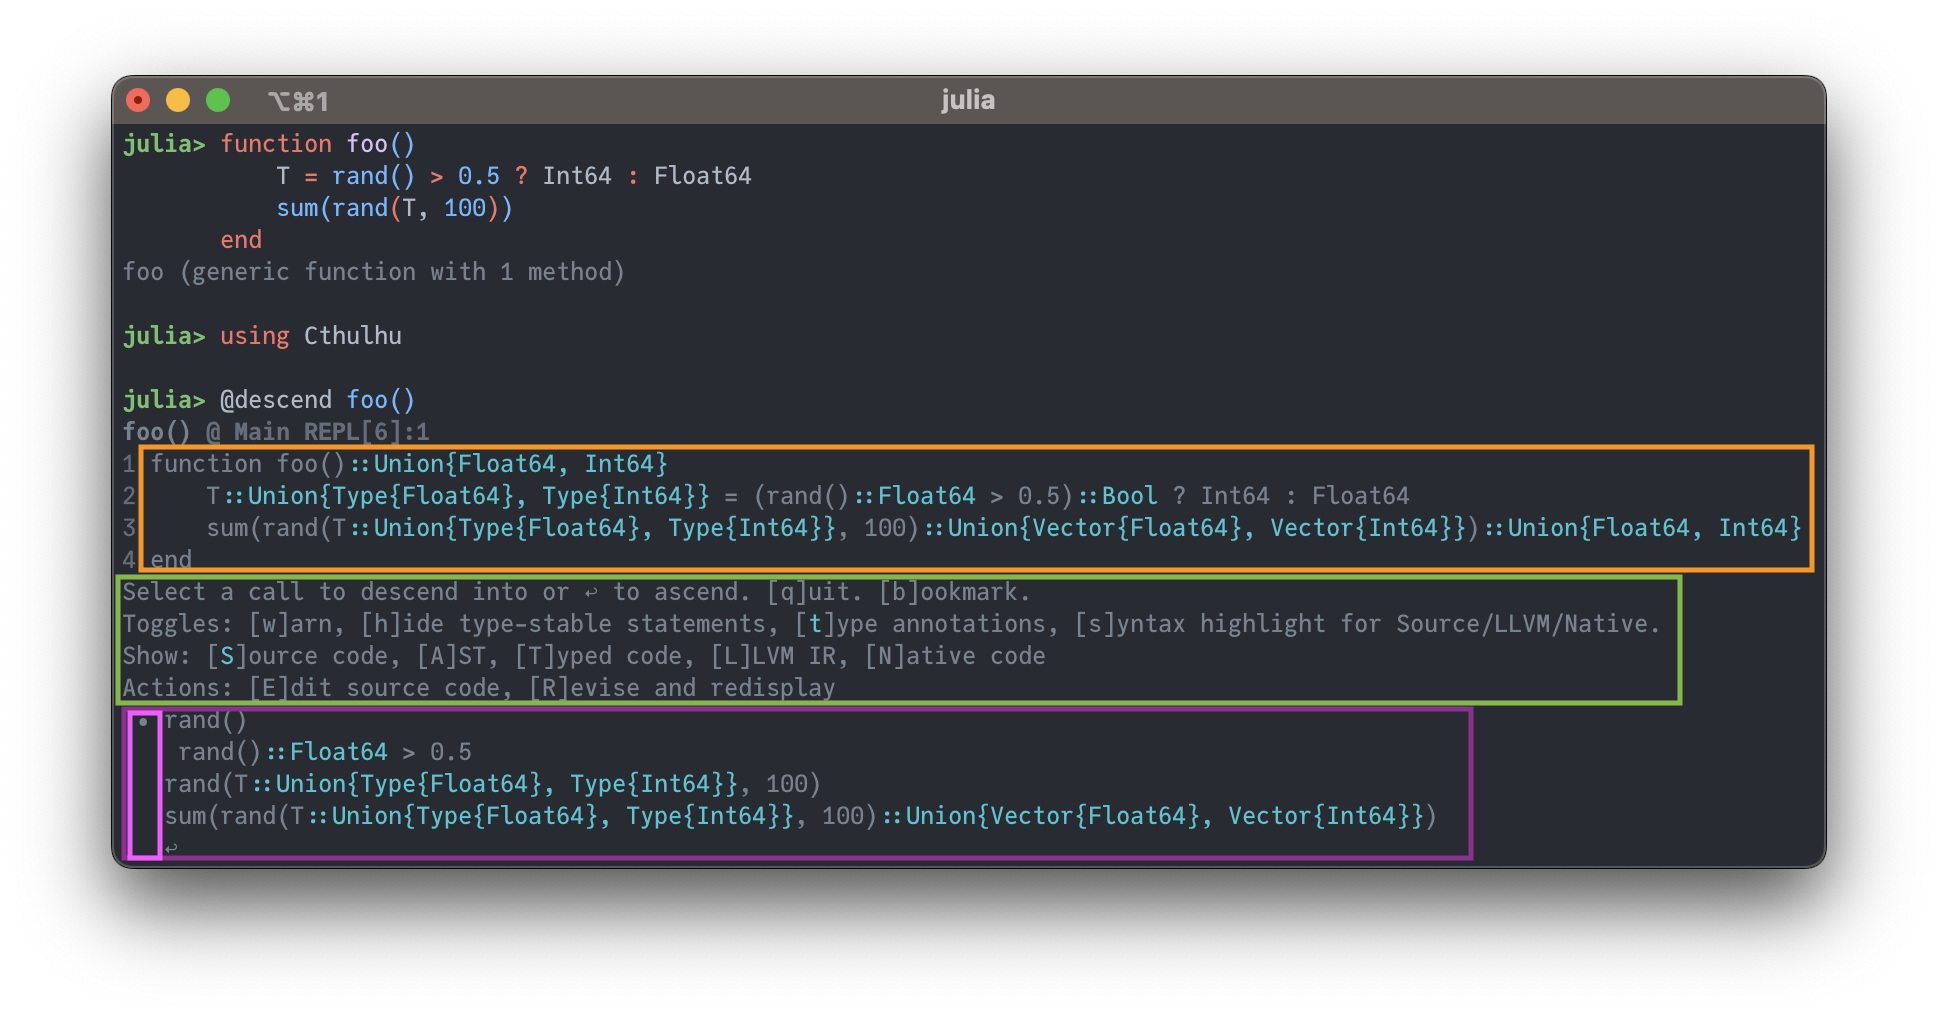
At the top of the output (orange box), the original source code is shown with additional annotations of inferred types, e.g. Union{Float64, Int64}. By default, source code format is used, which can be nicer than @code_warntype's IR.
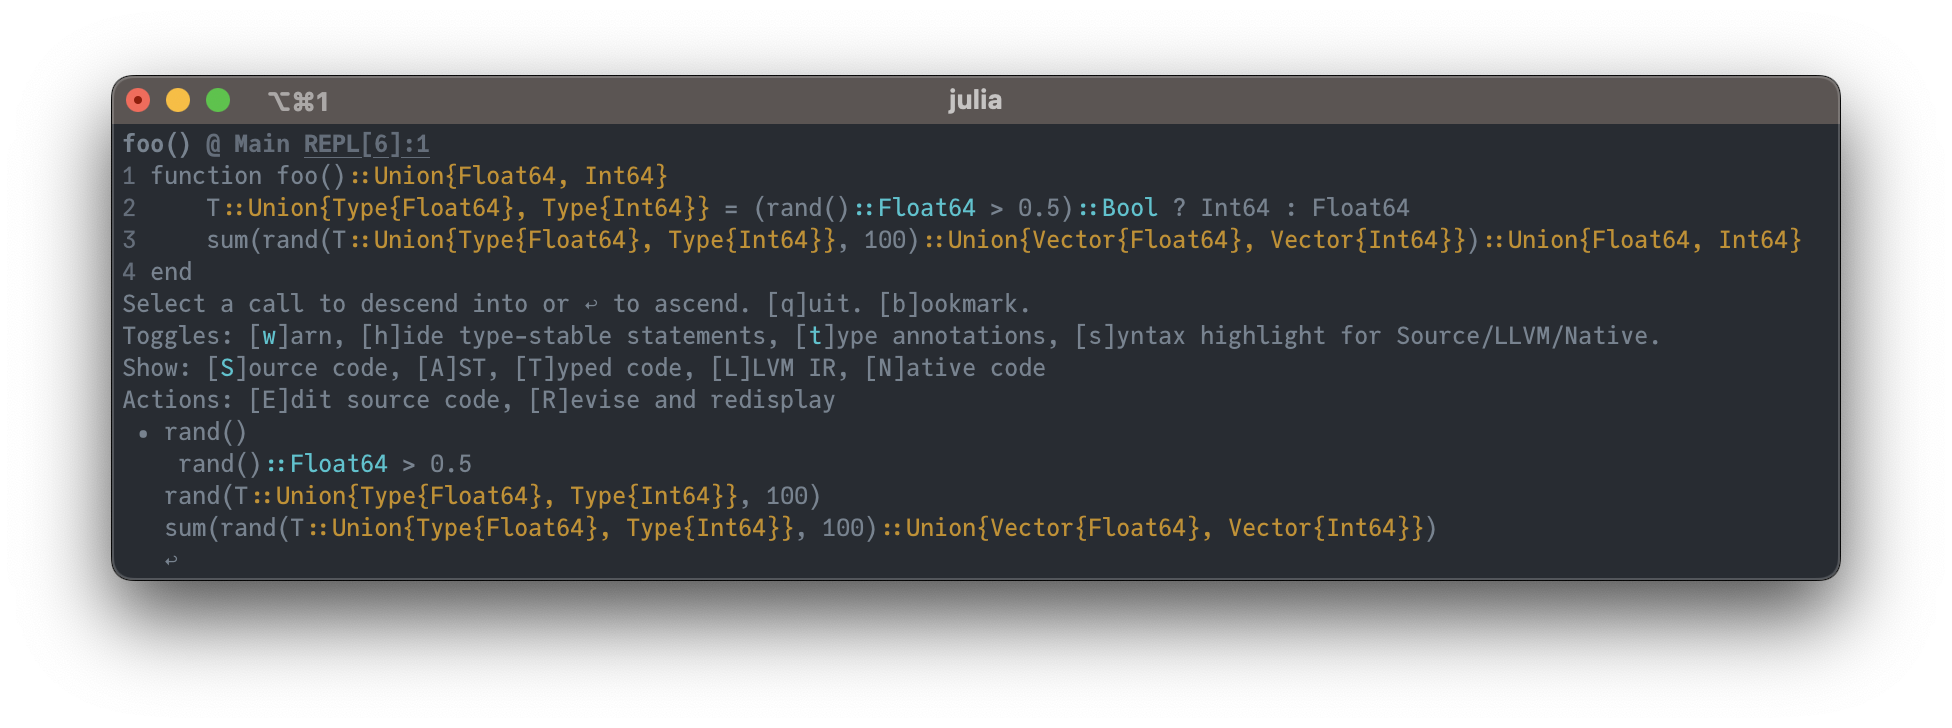
The second section (green box) shows the interactive interface of Cthulhu.jl. The letters in [ ] brackets are the keys that need to be typed to toggle options. For example, pressing the w key will highlight union types in yellow and code with poor type inferability in red:
The bottom-most section (purple box) allows us to move deeper into the code. Using the arrow keys, the cursor • (pink box) can be moved to select a specific function call. Hitting enter will recursively "descend" into the code. To "ascend", place the cursor over ↩ and hit enter.
Acknowledgements
Snippets for profiling are taken from ProfileView.jl and Cthulhu.jl. Many thanks to Théo Galy-Fajou for helpful discussions.
Website, code and notebooks are under MIT License © Adrian Hill.
Built with Franklin.jl, Pluto.jl and the Julia programming language.